P300 DB documentation
A database of the CBP/p300-regulated acetylome, proteome, and transcriptome in murine embryonic fibroblasts (MEFs). This document provides information about various features of the database, and a brief explanation of the various parameters used.
The database modules
The database is composed of three modules with the following functions:
| Symbol search: | All quantified acetylation sites, proteins and transcripts abundance in CBP/p300. |
| Domain search: | Batch query of proteins by specific domain, for example, bromodomain, PHD, or HAT domain. |
| Conserved sites: | Acetylation sites that are conserved between mouse and human, and their regulation in KATi-treated cells. |
Symbol search:
To access the p300 DB, click on the ”Symbol Search” tab and query by official gene symbol, UniProt identifier, or ENSEMBL identifier.
The results page displays the following content:
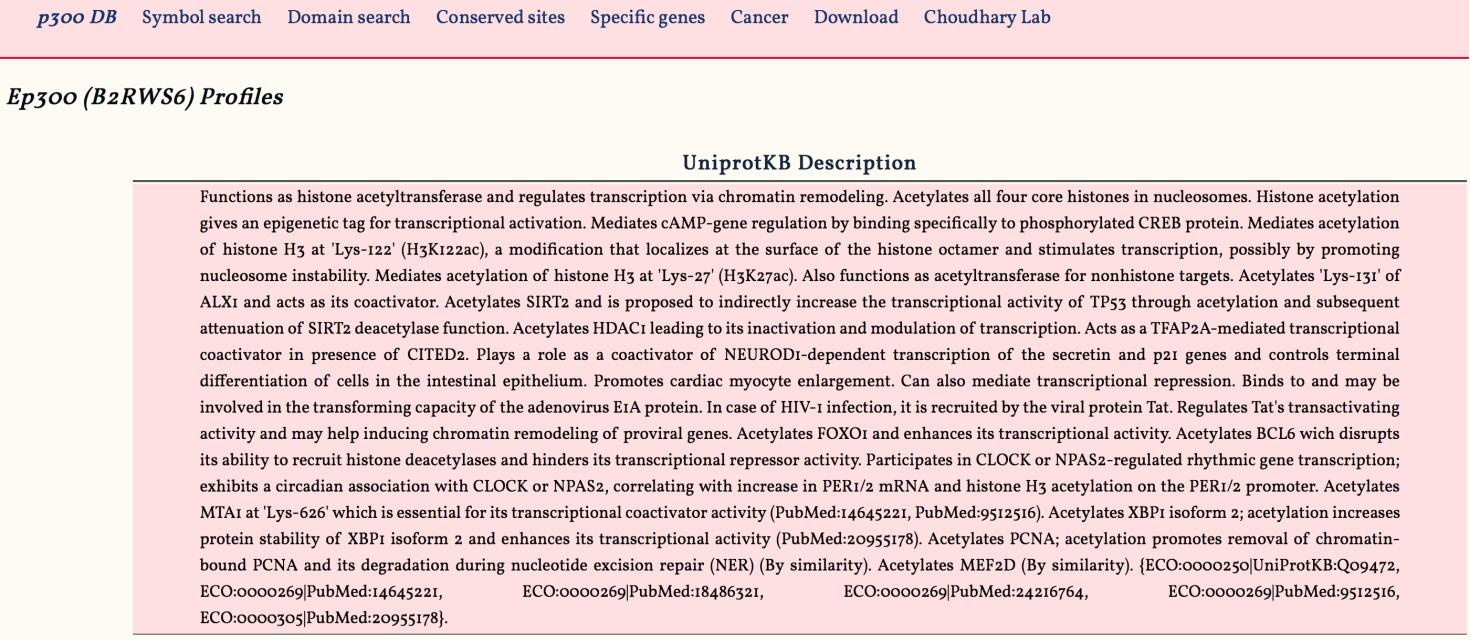
1. UniprotKB Description:
This panel displays the functional annotation of the query protein. The annotation information is obtained from the Uniprot knowledge database ( UniprotKB).

2. UniprotKB Localization:
This panel displays the subcellular localization annotation of the query protein. The annotation information is obtained from the Uniprot knowledge database (UniprotKB).

3. Gene Expression Regulation:
This panel displays CBP/p300-dependent regulation of query protein at the level of protein (proteome) and mRNA (transcriptome) in CBP/p300 KO, KATi-, and BRDi-treated MEFs. The magnitude of changes in protein and mRNA abundance is displayed in a bar chart, and the scale at the bottom shows log2 fold-change. “Down” and “Up” indicates downregulation and upregulation, respectively, of protein and mRNA abundance. The description of columns is as following:
| KO_proteome: | The relative changes in protein abundance | (KO/control) |
| KO_transcriptome: | The relative changes in mRNA abundance | (KO/control) |
| KATi_proteome: | The relative changes in protein abundance | (KATi/control) |
| KATi_transcriptome: | The relative changes in mRNA abundance | (KATi/control) |
| BRDi_proteome: | The relative changes in protein abundance | (BRDi/control) |
| BRDi_transcriptome: | The relative changes in mRNA abundance | (BRDi/control) |

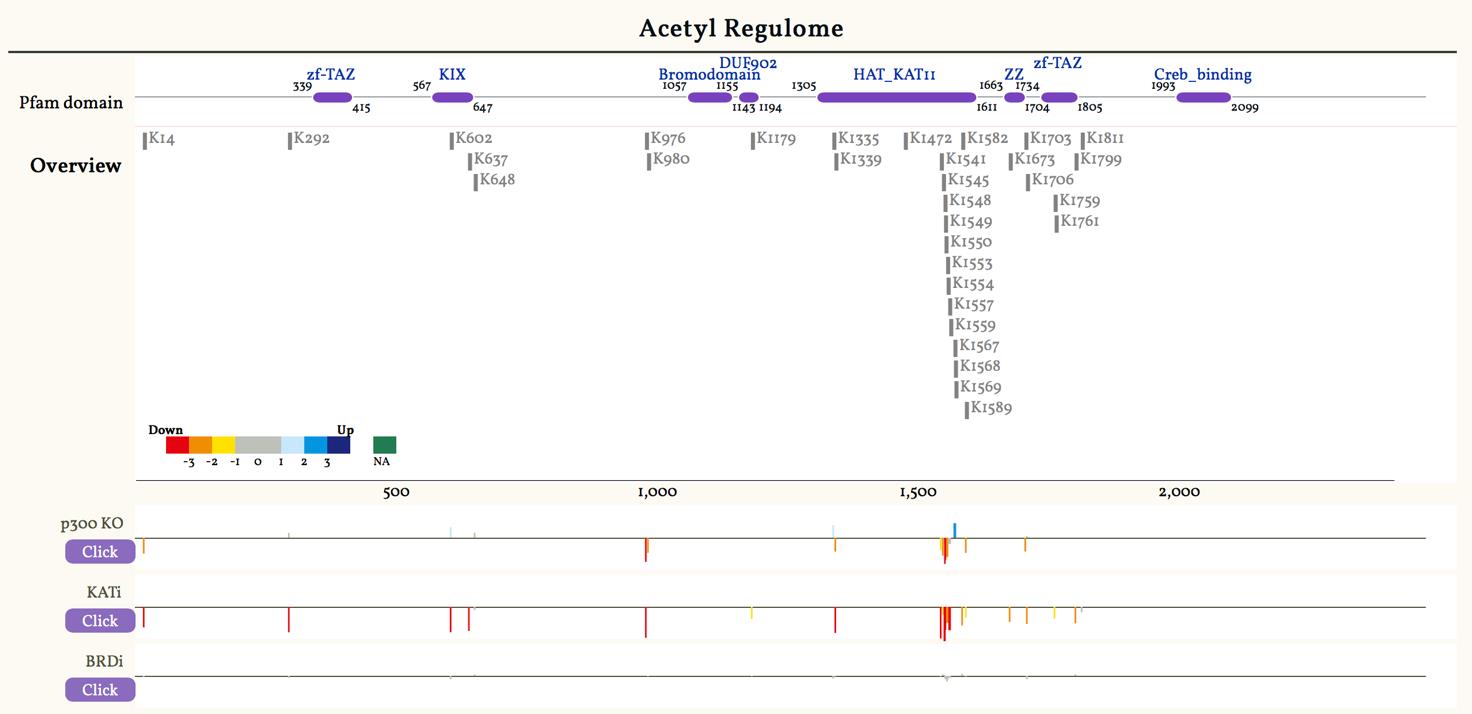
4. Acetyl Regulome:
Pfam domain:
The top of this panel displays schematic of query protein, and PFAM annotated domains in query protein are marked. This feature is interactive, allowing the user to click on the displayed domain. If selected, the resulting page will display all proteins in p300 DB that contain this domain. This feature allows the user to get a quick overview of proteins with specific domains. The result page is also interactive, allowing user to further access information all aspects of the database.
Overview:
Displays all acetylation sites identified in the protein and their positions. Protein length and position of the sites is shown at the bottom.
The lower part of the panel displays quantification of acetylation sites on the protein. Quantification is summarized separately for KO, KATi and BRDi experiments. The color and height of the ”sticks” displays the degree of regulation, as well as their relative position in the protein. This feature gives a quick overview of acetylation site regulation in the three experimental conditions. The ”click” tab below each of the indicated experimental condition enables analysis of acetylation sites in the chosen condition. The ”overview” panel is now switched to show acetylation site regulation in the chosen experiment, and the color key shows the log2 SILAC ratio (KO/Control, or KATi/Control, or BRDi/Control).

5. Data Table:
This table displays the following information.
| Position: | Amino acid position of acetylation site in query protein |
| Sequence Window: | Amino acid sequence flanking the acetylation site |
| p300 KO: | Log2 fold-change ratio of acetylation site (KO/Control) |
| KATi: | Log2 fold-change ratio of acetylation site (KATi/Control) |
| BRDi: | Log2 fold-change ratio of acetylation site (BRDi/Control) |
| Counts (p300 KO): | Spectral count for acetylation site in MEF KO experiments |
| Counts (KATi): | Spectral count for acetylation site in MEF KATi experiments |
| Counts (BRDi): | Spectral count for acetylation site in MEF BRDi experiments |
| Other Uniprot Ids: | Uniprot IDs that match to the identified acetylated peptide sequence |
By default, the table displays 10 acetylation sites, but this can be changed as desired by clicking on “show”. The table can be sorted by clicking next to the tabs. Furthermore, the table can be exported in the indicated formats.

6. Deacetylation kinetics
This panel displays the deacetylation kinetics after KATi-treatment. In default, the SILAC log2 ratio values of all the calculated sites are shown.

By moving the mouse on the table, the deacetylation kinetics of individual acetylation sites is displayed by a red curve.

7. Acetyl-regulatory interacting network
This panel displays the network of CBP/p300-regulated proteins that interacts with queried protein. The proteins in the network are colored according to the maximum degree of downregulated acetylation. The interactive network allows one to click on any proteins in the network to access the database entry for that protein. The network is generated based on interaction data from the BioGrid database. The slide bar at the bottom can be used to set the stringency of interactions, and the user can zoom-in or out to further inspect the network.

Domain search:
This function allows a batch query for all proteins with a specific domain, for example bromodomain, PHD, or HAT domain. Click on the tab “Domain search” and type a domain name that you wish to query. The result page shows proteins that contain the queried domain, and for each protein a schematic line diagram provides a quick overview of the identified acetylation sites and their regulation in KO, KATi, and BRDi experiments. Further information can be obtained by clicking on protein of interest.

Conserved sites:
This module enables inspection of conserved acetylation sites in mouse and human cells. For conserved acetylation CBP/p300-dependent changes in acetylation are shown. Click on the module “Conserved sites” and type a protein name in the search field. The result page displays the following information:
| Symbol (Mouse): | Gene symbol for the indicated mouse protein |
| Symbol (Human): | Gene symbol for the indicated human protein |
| Uniprot ID (Mouse): | Gene symbol for the indicated mouse protein |
| Uniprot ID (Human): | Gene symbol for the indicated human protein |
| Number of Acetyl sites (Mouse): | The number of identified acetylation sites (in MEFs) annotated to the indicated mouse protein |
| Number of Acetyl sites (Human): | The number of identified acetylation sites (in Kasumi-1 cells) annotated to the indicated human protein |
| Number of Conserved Acetyl sites: | The number of identified acetylation sites conserved between mouse (MEF) and human (Kasumi-1) |
| Links: | A button for more detailed information. |

By clicking on the "Links" button, the following quantitative information is displayed.
| Position (Mouse): | Amino acid position of acetylation site in mouse protein |
| Position (Human): | Amino acid position of acetylation site in human protein |
| Counts (p300 KO): | Spectral site count for acetylation site in MEF KO experiments |
| Counts (KATi): | Spectral site count for acetylation site in MEF KATi experiments |
| Counts (BRDi): | Spectral site count for acetylation site in MEF BRDi experiments |
| Counts (KASUMI): | Spectral site count for acetylation site in Kasumi-1 experiments |
| p300 KO: | Log2 fold-change ratio of acetylation site in MEF (KO/Control) |
| KATi: | Log2 fold-change ratio of acetylation site in MEF (KATi/Control) |
| BRDi: | Log2 fold-change ratio of acetylation site in MEF (BRDi/Control) |
| KASUMI: | Log2 fold-change ratio of acetylation site in Kasumi-1 (KATi/Control) |
